
Red State, Blue State, Green State, Yellow State
I got this idea from Daniel Drucker, who implemented it back when Flickr first started supporting geotagging.
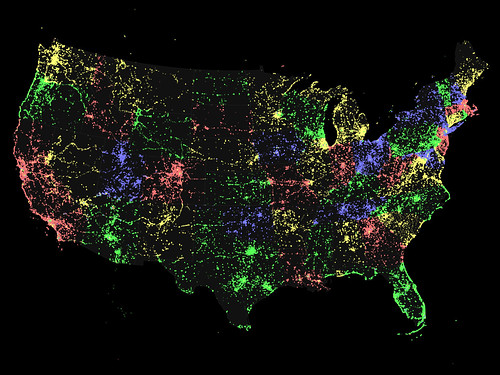
Th dots in the above illustration indicate the positions of about 1.2 million photos on Flickr tagged with the names of the lower 48 states: "Alabama", "Arizona", etc.
It took about 15 hours for my computer to collect this information using the Flickr API, and then just a minute or two to plot the dots using a Perl script + ImageMagick. Fortunately, I had 15 hours to work on that script beforehand :)
Each dot is colored, not according to its position, but according to its tag, which usually, (but not always!) corresponds to the state the photo was taken in.
So if a photo was tagged "New Jersey," it is colored reddish-pink, whether or not the dot actually appears within the boundaries of that state. Since most of the photos tagged "New Jersey" were indeed taken in the Garden State, the state comes out looking reddish-pink — and those smaller, densely populated states come out especially well in this system.
I also like the way the photos help bring out some of the major traffic arteries in less densely populated states, like Wyoming.
As Daniel suggested, I used only 4 colors, according to this table, which ensures that no two states of the same color touch.

October 31st, 2008 at 2:55 pm
Wow. That looks way more impressive now that there’s orders of magnitude more data available!